By Tara A Pelletier & Camilo Andrés Calderón Acevedo | March 18, 2025
Biogeography explores species diversification and distribution over time and space. Within biogeography, phylogeography investigates genetic diversity over geographic space, usually at the intersection between species and populations. When compared across multiple species, interesting evolutionary patterns can be uncovered. For example, comparing body size and dispersal capability of sister species in salamanders has uncovered spatial sorting. A quick search on Google Scholar of the term “comparative phylogeography” returned 15,500 results. Many of these studies can provide data for the newly emerging field of macrogenetics, allowing us to look at phylogeographic patterns on a much larger scale across 100s or even 1000s of species.
This large scale work requires the use of DNA sequence data from open-source repositories that can be linked to geographic coordinates. Initially these types of datasets were curated by hand, limiting the amount of data that could be gathered. An early attempt at collating global scale data using automated pipelines across 1000s of individuals resulted in DNA sequence alignments from over 8000 species of plants, animals, and fungi. Checks were made to assess the influence of noise in the data (e.g., mislabeled sequences or inverted GPS coordinates), and suggested that in some circumstances the noise was minimal and didn’t influence overall interpretations. However, this analysis took a conservative approach and dropped a lot of “bad” data. When zooming in on specific taxonomic groups (i.e., smaller datasets), things can become quite a bit messier.
First, the automated pipeline discussed above was streamlined to retain more datasets and come up with a strict set of rules on how to keep and label the data. Data came from a combination of GBIF, GenBank, and BOLD. Steps were taken to minimize duplicates and taxonomic discrepancies in a database called phylogatR, housing 87,000+ species and 102,000+ DNA sequence alignments (Figure 1).

Figure 1. The number of species with georeferenced DNA sequence data on phylogatR. Image credit: Sydney Decker
Even after this carefully thought-out pipeline, data cleaning steps are still necessary. For example, after downloading all the salamander data from phylogatR (152 species from various loci) there were misspellings in species names that were uploaded onto the original databases that would have been treated as different species if names had not been checked. Sequence alignments also need to be checked by eye as sometimes a gene was mislabeled resulting in a poor sequence alignment or short sequences had no overlap with other individuals. In the end, only 90 species had quality data for either COI, CYTB, or both, the most commonly sequenced mitochondrial genes. Each locus had fewer than 1000 DNA sequences, making visual checks of the sequence alignments not too overwhelming. However, it took a team of eleven people about five months to manually double the size of that dataset to conduct global scale analyses for just the CYTB data. In the end, important drivers of diversification and genetic variation were uncovered. Salamanders were more likely to harbor hidden genetic lineages when exposed to more variation in climatic variables. One the other hand, range size was the biggest driver of within-species genetic diversity and population genetic structure.
There are also differences in the availability and quality of the data across taxonomic groups. The salamander data analyzed from phylogatR only housed ~11% of currently known species (according to amphibiaweb.org), while the bat data, after filtering, contained ~23% of described species (according to batnames.org). The raw bat data had contained 429 species from over 20,000 sequences, and after quality checking and filtering down to one common locus (COI) there were still 343 species and over 14,000 DNA sequences (Figure 2). This made checking species names and sequence alignments more daunting, but the data were initially better aligned.
Recent taxonomic studies continue to generate large and open-source genomic datasets. This is particularly important for taxonomically problematic groups such as many understudied neotropical mammals. These studies, therefore not only help untangle relationships among taxa but provide open data for studies like ours. For the bat dataset, we used OTUs as units of analysis, bypassing the need for current taxonomy to match what has been uploaded in the past to open-source databases. Our goal was to explore phylogenetic diversity in this group. Even though sampling can be biased (note ecoregions in white did not have sufficient data to include in our analyses), we found that phylogenetic diversity in bats is higher in the tropics (Southeast Asia, Central and South America, and Africa), and has been driven by temperature variables, especially changes in temperature over long timeframes.
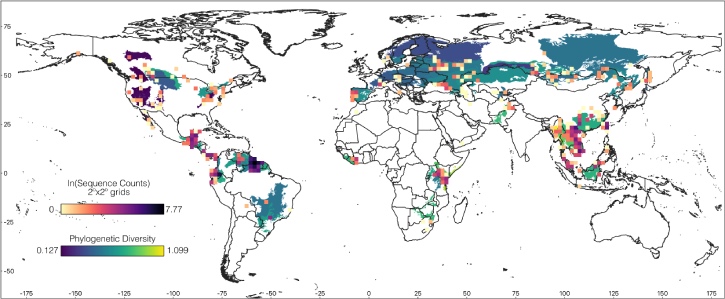
Figure 2. Global map displaying COI sampling and estimates of phylogenetic diversity in bats. Modified from Green et al. Image credit: Camilo Andrés Calderón Acevedo
Making science open, reliable, and transparent starts by making data open in a way that can be usable to other researchers. This increases the value of these data and allows for detection of large-scale patterns that can have conservation implications and give us a better understanding of evolutionary processes. However, we are conscious that there are still representation and recognition problems within science. Whereas different taxonomic research communities have adapted their research methods by advocating for collaborative, ethical and inclusive practices, there remains a lack of support for researchers of the Global South in some fields. The unethical use of researchers, data, and communities in the global south makes many researchers wary of sharing their datasets or making them publicly available. We’d like to encourage people in established institutions of the Global North to work together with those in the Global South and to remember that most of the biodiversity that fuels these datasets and biogeographic research is located in countries of the Global South.
Finally, regardless of the dataset used, teams should always include taxonomic experts for the groups they will be studying. We found that having people familiar with species names and phylogenetic patterns helped catch important errors in the data. While carefully thought-out automated pipelines with transparent checks of the data greatly enhance the amount of usable data that can be collected, we still spent a significant amount of time hand-curating a large amount of data, and this hand-curation is essential.
Tara A Pelletier, Associate Professor (tpelletier@radford.edu)
Department of Biology, Radford University, Radford, VA 24142
Tara A Pelletier is an Associate Professor of Biology at Radford University. She is broadly interested in the eco-evolutionary processes that have shaped current biodiversity patterns. Her lab works to integrate various types of data (genetic, geographic, environmental, life history, and morphological) to understand these complex processes, using methods from phylogeography, macrogenetics, and environmental DNA.
Camilo Andrés Calderón Acevedo, Post-Doctoral Researcher (CalderonCA@si.edu)
Smithsonian Bat Lab, Smithsonian Tropical Research Institute, Apartado 0843-03092, Balboa, Ancón, Panamá
Camilo Andrés Calderón Acevedo is a Colombian mammalogist, currently a researcher at the Smithsonian Tropical Research Institution, in Panamá. He is interested in mammal evolution with a particular interest in the cryptic diversity present in marsupials, bats and rodents. His research is focussed on the drivers of the different dimensions (phylogenetic, morphological and functional) of mammal diversity and the effects of climate change in their populations and landscape connectivity.